If I run a behavioral health organization, I need to watch seven numbers every month: turnover, vacancy, time to fill, overtime, supplemental staffing, caseload and billable utilization, absenteeism and engagement, plus labor cost per FTE and budget variance. Those metrics show where staffing pressure starts, how it affects patient access, and when it turns into added cost.
The article’s core point is simple: workforce data is leadership data. In behavioral health, that matters because burnout is high, turnover is often 30% to 50%, labor can make up 70% to 80% of the budget, and one open clinician role can cost about $30,000 in lost billable visits over three months. When I track the right KPIs, I can spot strain early and act before it hits care, revenue, and staffing levels.
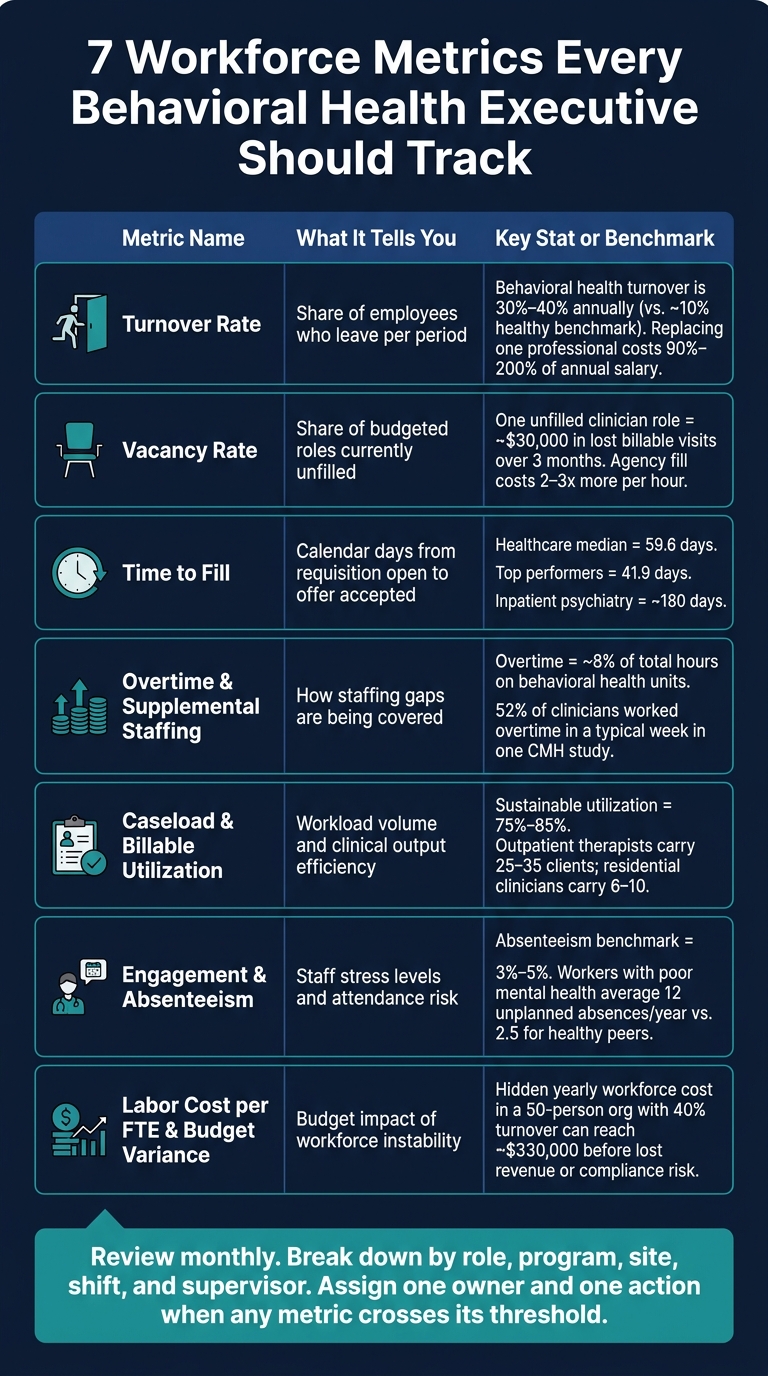
Here’s the full picture in one place:
- Turnover rate tells me how many employees leave.
- Vacancy rate shows how many budgeted roles are still open.
- Time to fill measures how long hiring takes.
- Overtime and supplemental staffing show how teams are covering gaps.
- Caseload and billable utilization show whether workload matches staffing.
- Engagement and absenteeism point to stress and attendance risk.
- Labor cost per FTE and budget variance show where staffing strain is hitting the budget.
Less admin.
Stronger teams.
Better client outcomes.
See how behavioral health organizations streamline documentation, staffing, and client engagement with ContinuumCloud.
Which solution would you like to explore?
Quick Comparison
| Metric | What it tells me | Why I should care |
|---|---|---|
| Turnover rate | How many people leave | High exits disrupt care and add replacement cost |
| Vacancy rate | How many roles are unfilled | Open roles slow access and add workload |
| Time to fill | How long hiring takes | Slow hiring leads to overtime and lost capacity |
| Overtime / supplemental staffing | How gaps are being covered | Extra hours and agency use push up labor spend |
| Caseload / billable utilization | Workload and clinical output | Shows underuse, overload, or mismatch in staffing |
| Engagement / absenteeism | Staff strain and call-out patterns | Low morale and more absences often come before exits |
| Labor cost per FTE / budget variance | Budget impact of workforce issues | Shows when staffing problems are turning into cost problems |
The main takeaway: I should review these metrics monthly, break them down by role, program, site, shift, and supervisor, and assign one owner and one action when a number moves past a set threshold.
Why Workforce Metrics Matter More in Behavioral Health
Behavioral health care works differently from many other care settings. It runs on trust, consistency, and the relationship between a patient and clinician. So when a clinician leaves, the damage goes beyond an open role. It can disrupt attendance, weaken engagement, and break continuity of care.
The data makes that plain. Research shows that youth who lose their therapist are 86% more likely to miss a future therapy session, and about 33% disengage from care entirely when they’re assigned to a new provider. That means retention isn’t just an HR metric. It’s a workforce KPI tied directly to patient care. And once care is disrupted, the financial hit usually follows fast.
Labor is the biggest operating cost for most behavioral health organizations, so workforce instability shows up on the income statement in a hurry. “One unfilled clinician role can result in significant lost billable capacity over several months.”, while agency and contract clinicians can cost significantly more per hour than permanent employees.
There’s also a compliance angle that’s easy to miss until it becomes a problem. Behavioral health billing depends on active, valid credentials - LCSWs, LPCs, BCBAs, and others. If a license lapses or a credentialed role sits empty, care doesn’t just slow down. Revenue can stop right away, and audit risk goes up. A workforce dashboard should flag these issues early, before they disrupt care or billing. In many cases, the first warning signs appear in workload, overtime, and turnover.
Turnover rates in behavioral health are often steep. Annual turnover usually falls between 30% and 40%, and some organizations report rates as high as 70%. That’s far above the roughly 10% often seen as a healthy benchmark. When clinicians leave, caseloads grow. Then burnout kicks in. Then more people leave. It’s a tough cycle, and it gets expensive fast. In a 50-person organization with 40% turnover, the hidden yearly workforce cost can reach about $330,000 - and that’s before lost revenue or compliance risk is added in.
That’s why leaders need a balanced set of KPIs. The goal isn’t just to count headcount. It’s to spot where staffing strain is building across:
- staffing health
- hiring speed
- productivity
- engagement
- labor cost
The seven metrics below help show where the workforce is starting to crack - and where leaders should step in first. Turnover rate is the clearest place to begin.
1. Workforce Turnover Rate
Turnover rate shows the share of employees who leave your organization during a month, quarter, or year. The formula is simple:
Turnover Rate (%) = (Number of separations ÷ Average number of employees) × 100
Here’s a plain-English example. If a community mental health center averages 250 employees across a year and 60 people leave, the annual turnover rate is 24%. For this math, the denominator should be your average headcount, not a single point-in-time employee count.
Why does this metric matter so much? Because every exit has a ripple effect. One person leaves, and suddenly care continuity takes a hit, workloads shift, and costs start piling up. Turnover is a clear sign of retention risk, care disruption, and replacement cost.
And that replacement cost can be steep. Replacing an employee can cost 90% to 200% of their annual salary when recruiting, training, lost productivity, and other turnover costs are included. For senior or specialized roles, that number can climb to 400%. The most expensive stretch usually comes during ramp-up, before the new hire reaches full productivity.
This is why it helps to break turnover into smaller slices instead of stopping at one headline number. Look at turnover by:
- Role
- Program
- Tenure
- Voluntary vs. involuntary exits
That level of detail changes the picture. About 35% of new behavioral health hires leave within their first six months. An agency might post 22% overall turnover, but that same agency could be dealing with 40% turnover among direct-care residential staff and 15% among licensed therapists. Those are not the same problem, and they shouldn't get the same fix.
When you segment the data, you can see where staffing pressure is building first and where leaders need to step in soonest.
High turnover usually shows up next as open roles and staffing gaps.
2. Vacancy Rate
Turnover tells you how many people left. Vacancy rate tells you how many seats are empty right now.
It’s the share of your budgeted or authorized positions that are still unfilled:
Vacancy Rate (%) = (Vacant FTEs ÷ Total Budgeted FTEs) × 100
So, if you have 100 budgeted FTE positions and 12 are open, your vacancy rate is 12%.
In behavioral health, an open role isn’t just an HR issue. It hits care access too. A 20% clinician vacancy rate in an outpatient program can lead to lower intake, longer waitlists, and heavier caseloads for the people still on staff. One unfilled clinician role can result in about $30,000 in lost billable visits over a three-month period. And if an organization brings in contract or agency clinicians to cover the gap, those workers can cost 2 to 3 times more per hour than permanent full-time employees. The role is still vacant - and now it costs more.
Organizations should establish vacancy thresholds based on their staffing model, roles, programs, and patient-access requirements. Even a modest vacancy rate can create significant pressure when it affects hard-to-fill clinical positions.
That said, behavioral health doesn’t always play by neat cutoff points. Even a modest vacancy rate in a hard-to-fill clinical role can have a big effect on day-to-day work. Context matters more than any single number.
That’s why segmentation matters. A blended vacancy rate across the whole organization can hide serious staffing gaps. Break it out by role, program, location, license, and shift, and the number starts to mean something. A 10% overall vacancy rate looks very different if all of it sits in your crisis stabilization unit.
The next question is how fast those vacancies turn into filled roles.
3. Time to Fill
Time to fill tracks the number of calendar days from requisition opening to offer acceptance, as long as you use the same endpoint across every report. A simple formula for multiple openings looks like this:
Time to Fill = Total days open for all filled positions ÷ Number of positions filled in that period
Here’s a plain example. If five therapist roles were filled in one quarter, and those jobs stayed open for 30, 45, 60, 40, and 50 days, the average time to fill is 45 days (225 ÷ 5).
This metric matters because slow hiring doesn’t just sit on a dashboard. It turns into overtime, agency use, and staff burnout. The longer a role stays open, the longer the organization carries the strain of coverage and the loss of capacity.
Benchmarks change by role. Healthcare benchmark data shows a median time to fill of 59.6 days, while top-performing organizations close roles in 41.9 days. For harder-to-fill positions, the timeline jumps fast. Inpatient psychiatry roles can take around 180 days to fill. That’s about six months of delayed access and lost capacity.
A blended average can smooth over the real problem areas. It’s better to break time to fill out by:
- Role type: psychiatrists, therapists, peer support specialists
- Program: outpatient, residential, crisis services
- Location: urban vs. rural
That kind of cut makes delays easier to spot. Maybe requisition approvals are dragging. Maybe interview scheduling is the choke point. Maybe credentialing slows things down right at the finish line. Once leaders can see where the lag sits, they can go after the right bottleneck in approvals, interviewing, or credentialing. And in many cases, those delays show up first in overtime and supplemental staffing.
When fill times stretch, teams rely more on overtime and supplemental staff.
4. Overtime and Supplemental Staffing Use
When time to fill drags out, teams usually patch the hole with overtime and supplemental staff.
For many nonexempt employees covered by the FLSA, overtime generally applies to hours worked over 40 in a workweek and is paid at 1.5× the regular rate. Supplemental staffing covers temporary, PRN, agency, and contract labor brought in to fill gaps.
Three formulas give leaders a clean place to start:
- Overtime Hours % = (Total Overtime Hours ÷ Total Paid Hours) × 100
- Supplemental Hours % = (Agency/Temp/PRN Hours ÷ Total Worked Hours) × 100
- Supplemental Labor Cost % = (Agency/Temp/PRN Labor Cost ÷ Total Labor Cost) × 100
These numbers make more sense when you track them next to vacancy and time to fill. That helps show whether staffing gaps are turning into a chronic problem. Put simply, overtime isn't just a cost issue. It can also be a retention warning sign.
The numbers back that up. On mental health and substance use units, overtime made up about 1.9 million of 23.2 million total hours (about 8%) in 2021–2022, which put these units among the highest across unit types. In behavioral health and IDD programs, overtime also added between $2.64 million and $12.34 million in extra labor cost.
The human side matters too. Sustained overtime is linked to burnout, work-life conflict, and lower confidence in care quality. In a community mental health study, 52% of clinicians said they worked overtime in a typical week. Those who did had higher burnout, more work–life conflict, and lower perceived quality of care. And once that pattern sets in, it can speed up turnover and make understaffing even worse.
This metric gets useful when you break it down by role, program, shift, and location. A single overtime rate for the whole organization can hide where the problem actually lives. One unit may be fine, while another is leaning on the same night-shift staff week after week. Dashboards should flag overtime by role, program, shift, and cost center.
Those coverage gaps show up next in caseload and billable utilization.
5. Caseload and Billable Utilization
Caseload tells you how many active clients a clinician is carrying. Billable utilization shows how much of that person’s available work time turns into reimbursable client care. Put simply, caseload points to volume, acuity, and service demand. And the pressure from overtime and extra staffing tends to show up here next.
The formula for billable utilization is simple:
Billable Utilization (%) = Billable Hours ÷ Available Productive Hours × 100
Organizations should define available productive hours consistently based on their staffing model and reporting objectives. Before you track this metric, set the reporting period and decide what counts as billable. At 75% utilization, a 40-hour week works out to about 30 billable hours. In outpatient settings, 75% to 85% utilization is often a level teams can keep up over time.
Low utilization can point to unused capacity. High utilization can point to burnout risk. That’s why it helps to track both at the same time. A therapist may carry 30 active clients but only see 20 in a given week. On the flip side, even a moderate caseload can feel heavy if the clients have high acuity.
Benchmarks also shift a lot by role. For example:
- Outpatient therapists often carry 25 to 35 clients
- Residential clinicians often carry 6 to 10 clients
When you look at caseload and utilization together, you get a clearer picture of whether staffing lines up with actual clinical demand. Break the data out by service line, role, location, and client acuity, and it becomes much easier to use. If the data isn’t connected well, those gaps stay hidden. Then underused capacity on one side and stretched teams on the other can sit in plain sight without anyone seeing the full picture.
When workload stays out of sync for too long, engagement falls and absences start to climb.
6. Employee Engagement and Absenteeism
When workload pressure climbs, absenteeism is often the next red flag.
In behavioral health, absenteeism means unscheduled time away from work: last-minute call-outs, no-shows, and unexpected sick days. It does not include approved PTO, holidays, or protected leave. Use this formula:
Absenteeism Rate (%) = (Total Unscheduled Absent Days ÷ Total Available Workdays) × 100
Here’s a simple example. If a clinic with 50 employees records 120 unscheduled absences in one quarter and has 3,000 available workdays, the absenteeism rate is 4%.
That number only means something if your definitions stay consistent. Set one standard across sites and programs, including how you count partial days. Otherwise, you end up comparing apples to oranges. A working range of 3% to 5% is a good benchmark. If the rate goes above 7%, it’s time to take a closer look.
Engagement and absenteeism tend to move in the same direction. Workers with poor mental health average nearly 12 unplanned absences per year, compared with 2.5 days for those in better health. And actively disengaged employees can cost about 34% of annual salary through lost productivity and absenteeism.
That’s why it helps to track both measures by:
- role
- program
- location
- shift
- tenure
This is where the pattern starts to tell a story. A spike among overnight case managers in residential care points to a different problem than a drop in engagement across the full organization. Persistent absenteeism also tends to show up in labor cost and budget variance.
When absenteeism goes up at the same time engagement slips, labor costs usually aren’t far behind.
7. Labor Cost per FTE and Workforce Budget Variance
This is the point where staffing pressure shows up in the budget.
Labor cost per FTE measures the total amount spent to support a given role - salary, benefits, and overhead - divided by the number of FTEs in a program, department, or across the full organization. The formula is simple:
Labor Cost per FTE = Total Labor Expenses ÷ Total FTEs
One detail matters a lot here: if you leave out temporary, per diem, and travel staff, your labor cost looks lower than it actually is. And that’s a problem, because supplemental staffing is often where vacancy costs quietly pile up.
Budget variance turns this from a reporting metric into something leaders can act on. When actual labor costs don’t match the budget, the gap usually points to overtime, vacancies, pay changes, or temporary coverage. If you track that variance early, you can spot the cause fast and deal with it before it starts affecting care delivery or required staff-to-client ratios.
The real value comes from breaking the number apart. Look at variance by:
- Program
- Location
- Role
- Funding source
That view makes the story much clearer. A budget overrun at one residential site means something very different from a pattern showing up across the whole system.
Dashboard Views and Benchmarking for Executives
Once the seven KPIs are set, group them into four executive dashboard views. The point isn’t to pile on more reports. It’s to give leaders fewer views with the right filters so they can spot the small number of metrics that need action now.
Here’s a simple way to package those seven KPIs:
| Dashboard View | Key Metrics | Filter Dimensions |
|---|---|---|
| Workforce Stability | Turnover rate, vacancy rate, days vacant | Department, program, location, supervisor |
| Recruitment Efficiency | Time to fill | Job role, service line, recruiter |
| Financial Impact | Budget variance, labor cost per FTE | Funding source, cost center, position |
| Operational Capacity | Caseload volume, billable utilization, overtime hours | Service line, program, shift |
Each view should be filterable by department, job role, service line, program, and location. That part matters more than it may seem. System-wide numbers often look clean on the surface, but they rarely show where a team needs to step in.
Turnover by supervisor is a good example. Overall turnover can mask the actual issue if one program or one supervisor is driving most exits. A supervisor-level filter helps leaders see where support, coaching, or a shift in team norms may be needed first.
For benchmarking, start with your own historical baseline. That gives you a grounded point of comparison before you set internal targets by program or service line.
Once the dashboard points to the outliers, assign owners and set thresholds for action.
How to Turn These Metrics Into Action
Once your dashboard flags an outlier, move to the smallest unit where the issue shows up. If a KPI crosses its threshold, assign one owner, one timeline, and one target. The next move should be specific. Not a vague goal. Use the same dashboard filters to pinpoint where the problem sits before you pick a fix.
Start with the metrics that hit care access most directly. Frontline turnover usually affects patient access first. If annual voluntary turnover for licensed clinicians goes above 20% - or keeps climbing quarter over quarter - treat it as a local issue first. If turnover is rising faster in one program than in others, look at that program as a staffing problem and use exit interviews and stay interviews to find the cause. Common drivers include overtime, pay, staffing ratios, or supervision. If turnover doesn't get fixed, the strain usually spills into vacancies, overtime, and burnout.
Track time to fill and overtime together because long vacancies create coverage pressure. Slow hiring often leads straight to overtime, so fix the hiring bottleneck that's slowing down fills. If overtime remains elevated for several months, that's a signal to investigate staffing capacity, scheduling, and workload. Possible responses include:
- Adding a float pool
- Redesigning shifts to cover high-demand windows
- Improving recruitment speed
- Offering more schedule flexibility
If that pattern keeps going, the cost usually starts to show up in labor expense and budget variance.
Labor cost per FTE and budget variance show where staffing strain starts to hit the budget. Labor cost per FTE means total labor expense divided by FTEs. Include temporary and per diem labor in that total. Treat variance as an early warning, not something you notice only at month-end. If labor cost per FTE is rising faster than volume or reimbursement, or if workforce expenses keep running more than 3% to 5% over budget, check the driver before cutting positions.
High agency spend, inefficient skill mix, and avoidable overtime are common causes. And each one calls for a different fix. You might redesign workflows so appropriate tasks move from higher-cost clinicians to qualified support staff. Or you might expand group therapy when it's clinically appropriate. Both can lower cost per FTE without hurting care quality.
Every action plan needs three things:
- An owner
- A deadline
- A follow-up metric
Use the same KPI to see if the change worked.
Conclusion
Behavioral health workforce management comes down to a small set of KPIs tracked on a steady basis. Those metrics matter because they tie staffing health directly to access, quality, and cost.
Taken together, they show where staffing pressure begins, how it affects access and continuity, and when it starts driving up costs. That’s why executives need to see them in one place.
These KPIs work best in a single dashboard. When HR, scheduling, payroll, and clinical data sit in one view, teams can respond faster. Once those data streams are brought together, review shifts from reporting to action.
At the executive level, review these metrics monthly. Then dig into the details by program, site, or role when a metric crosses a risk threshold. With monthly review and role-based drilldowns, leaders can spot problems early and act on them.
FAQs
Which workforce KPI should I prioritize first?
Start with position control. It gives you a clear view of authorized roles, open positions, and budget alignment. That makes it easier to manage labor costs, stop unbudgeted hiring, and allocate resources with more control.
Once position control is in place, track other key metrics like turnover rate, time-to-fill for critical roles, labor cost per position, and vacancy duration.
How often should I review these metrics?
Ideally, review workforce metrics in real time so you can make timely, data-based decisions. With a unified platform, you can spot changes as they happen instead of waiting on old, manually compiled reports.
For the longer view, check indicators like turnover and retention each month to spot patterns. Then watch metrics like vacancy rates, overtime, and caseloads in real time so you can catch warning signs early.
What thresholds should trigger action?
Set clear benchmarks tied to your service lines and budget limits. Then use automated alerts to flag leadership when metrics, such as labor costs on a given contract, get close to those limits.
It also helps to watch real-time dashboards for early warning signs. Think rising vacancy rates or slower documentation completion. Those signals give you time to adjust scheduling, caseloads, and staffing or other resources before small issues turn into bigger ones.