If you can’t see staff strain week by week, you’ll usually act too late. In behavioral health, 93% of behavioral health workers report having experienced burnout, 62% say it is moderate or severe. Behavioral health turnover rates are often reported in the 30% to 40% range. Themain takeaway is simple: leaders can lower burnout risk by tracking workload, overtime, documentation backlog, PTO use, vacancies, and absences in one place instead of waiting for monthly reports.

Here’s the short version:
- Monthly reports lag too much. By the time overtime, call-outs, or resignations show up, the problem may already be deep.
- Burnout often shows up first in daily work data. Think uneven caseloads, late notes, open shifts, after-hours charting, and too little time off.
- One system is not enough. EHR data shows client load and charting pressure. HCM data shows overtime, PTO, attendance, and vacancies.
- Dashboards matter only if they lead to action. Organizations need clear rules for when to rebalance caseloads, add coverage, protect charting time, or speed up hiring.
- Results should be tracked across staff, care, and compliance. That means looking at turnover, overtime per FTE, note timeliness, no-shows, continuity of care, denials, and audit issues together.
A few numbers make the point fast:
- Clinicians spend 1.77 hours per day on documentation after scheduled hours
- Heavy after-hours EHR use is tied to 4.78 to 12.52 times higher odds of high exhaustion
- Replacing one clinician can cost 90% to 200% of annual salary
- One open clinician role can cost about $30,000 in billable revenue over 3 months
Here’s the core idea in plain English: if I can see strain early, I can shift work early. That is the difference between preventing burnout and reacting to it.
What Workforce Visibility Means and Which Metrics Matter Most
Workforce visibility means having timely, connected data that shows who is working, how heavy their load is, and where strain is starting to build. The goal is simple: help leaders step in before strain turns into burnout, resignations, or gaps in care.
That view usually pulls data from scheduling, EHR, payroll, and HR systems into one place leaders can use day to day. In practice, the signals tend to fall into three groups: workload, time, and retention.
Caseload Distribution, Productivity, and Documentation Load
Caseload count by itself doesn't tell the full story. A 25- to 30-client caseload may be fine for low- to moderate-acuity outpatients, but it can become too much with a high-acuity panel. That's why useful visibility tracks client volume alongside acuity level, case mix, and contact hours - not just headcount.
Strain often shows up first in two places: client load and after-hours charting. Research shows that clinicians in the top half of after-hours EHR time had 4.78 to 12.52 times greater odds of high exhaustion compared with those below that threshold. That's a big warning sign.
A few patterns are worth watching closely:
- Note completion consistently falling outside the organization's expected documentation window.
- Open tasks remaining above established program thresholds.
- A sustained decline in completed sessions per clinician can be another signal worth investigating.
Put together, these measures can show when workload is drifting into unsafe territory, even before absences start to climb.
Overtime, Schedule Gaps, PTO Patterns, and After-Hours Work
Overtime and scheduling data often show strain that a caseload report misses. Consecutive long shifts, missed meal breaks, and last-minute coverage gaps are all measurable signs that a team is pushing past safe limits. After-hours EHR work - especially evening and weekend note completion - is also a form of invisible overtime that drives exhaustion.
Time away matters just as much as time worked. Staff who go months without taking real time off, or who keep maxing out PTO year after year, may be showing burnout risk in plain sight. When leaders look at PTO data next to caseload and overtime trends, the picture gets much clearer. Workers with poor mental health average nearly 12 unplanned absences per year, compared to just 2.5 days for those in better health.
When those patterns stack up at the same time, they point to overload long before staffing failures show up in a monthly dashboard.
Turnover Risk and Vacancy Pressure
Vacancies don't just leave empty seats. They shift pressure onto the people who are still there. One unfilled clinician role can cost about $30,000 in billable revenue over three months. And when vacancies drag on, burnout stops being only a wellness problem and starts becoming a staffing problem.
That's why it helps to watch metrics like vacancy duration, early tenure exits - turnover in the first six to twelve months - and internal transfers out of high-demand programs. These signals can show where burnout is quietly turning into a retention issue before resignations start to pile up.
That is why visibility has to stretch past workload and into retention pressure.
How to Build Workforce Visibility with EHR, HCM, Dashboards, and Alerts
The data is already there. The problem is that it lives in different places across the EHR and HCM. Workforce visibility starts when you connect those systems and turn them into one day-to-day view. A practical way to do that is to begin with the EHR, then layer in HCM data so leaders can see the whole staffing picture.
Using EHR Data to Track Scheduling, Caseloads, and Documentation Strain
An EHR like ContinuumCloud's Welligent helps turn workload data into something leaders can actually use. It structures scheduling and assignment data so managers can spot how clinical work is spread across staff at a glance. Appointment volume, clinician assignments, service types, and case mix can all be pulled into caseload views that show active client count, weekly volume, and color-coded overload thresholds.
That matters because a caseload number on its own doesn't tell the full story. A clinician with a "normal" count may still be overloaded if the mix of services is heavy or the weekly appointment load is stacked too high.
Documentation data adds a second signal. Welligent can generate automatic alerts for overdue progress notes, treatment plans, periodic reviews, and annual updates. In behavioral health, that burden is far from minor: clinicians can spend 10 to 14 hours per week on charting, and some document 1 to 2 hours for every hour of care delivered. When you track note timeliness and backlog size, you can see that strain early, before it turns into late-night charting and staff drag.
Using HCM Data to Monitor Overtime, Attendance, PTO, and Vacancies
If the EHR shows demand, the HCM shows staffing strain. ContinuumCloud's DATIS platform gives leaders an executive dashboard that brings vacancies, turnover trends, PRN staff use, and overtime patterns into one view. Managers can also get alerts when employees are nearing overtime or when credentials are close to expiration.
Time and attendance data from DATIS adds another layer. It can flag missing punches, negative leave balances, and open time records, which gives managers a way to catch attendance issues before they snowball. And when PTO data sits next to overtime and vacancy numbers, the story changes. What may look like one person's attendance issue can start to point to team-wide overload instead.
Combining Dashboards and Alerts for Faster Action
Once these signals are visible, dashboards can pull them into one operating view. Track 10 to 15 core metrics daily or weekly, including caseload distribution, documentation backlog, overtime, PTO use versus accrual, vacancy rates, and unscheduled absences.
Alerts are what turn that visibility into action. In Welligent, alerts can fire when caseloads move past set thresholds or when documentation backlog crosses a defined limit. In DATIS, alerts can flag sustained overtime, low PTO usage, or spikes in unscheduled absences. That gives managers a clear opening to redistribute work, change coverage, or step in early before strain gets baked into the week.
The comparison below shows what each setup reveals - and what it misses:
| Approach | What It Shows | Main Gap | Burnout-Prevention Value |
|---|---|---|---|
| EHR only | Caseloads, appointments, documentation timeliness | Misses overtime, PTO, and vacancy data | Partial view of clinical overload |
| HCM only | Overtime, attendance, PTO, vacancies, turnover | Misses patient demand and documentation burden | Partial view of labor strain |
| Unified dashboard + alerts | Combined demand, staffing, and documentation signals | Requires connecting data across systems | Best for early intervention |
Less admin.
Stronger teams.
Better client outcomes.
See how behavioral health organizations streamline documentation, staffing, and client engagement with ContinuumCloud.
Which solution would you like to explore?
How Leaders Can Use Visibility Data to Reduce Burnout
Data matters only when leaders do something with it. Once dashboards and alerts show the right signals, leaders need a clear response plan, not one more stack of reports.
Rebalance Caseloads and Staffing Before Overload Becomes Chronic
Visibility data helps leaders shift work sooner. If a dashboard shows a clinician carrying a caseload above the team average for several weeks, that should lead to action right away, not a long wait until the next quarterly review. In practice, that can mean moving lower-acuity clients, rotating intake and on-call duties, and protecting high-acuity ratios based on internal guidelines.
Client count alone won’t tell the full story. Leaders should also look at acuity, documentation time, and non-billable work to spot overload. If the same program keeps showing overtime week after week, that’s a sign to change staffing patterns, bring in per diem coverage, or move non-urgent tasks off overloaded clinicians. That can cut overtime and lower the risk of chronic exhaustion.
When leaders move fast on those signals, overload is less likely to become the default.
Set Regular Reviews and Clear Thresholds to Trigger Action
Visibility data changes very little without a routine around it. Weekly team huddles are a good way to review caseload spread, prior-week overtime, missed breaks, and documentation backlog, including anything overdue by more than 48 hours. Keep those huddles between 30 and 60 minutes with supervisors so teams can catch strain early, before it snowballs.
Monthly workforce councils can take a broader look across programs. That includes overtime, PTO use, vacancies, and turnover risk, along with decisions about hiring needs and coverage for periods with heavier demand. The key is to tie each metric to a clear response rule. For example: if documentation backlog exceeds a defined threshold for two consecutive weeks, protected charting blocks get added to the schedule.
That way, review meetings lead to decisions that ease strain in the same week.
Plan Coverage and Hiring with Better Demand Data
Historical scheduling and appointment data can show when demand actually shows up. EHR records may reveal that outpatient therapy requests keep peaking between 4–8 p.m. on weekdays, while morning slots stay underused. That kind of pattern gives leaders a better way to staff late-afternoon and evening hours instead of sticking to a 9-to-5 setup that doesn’t match client need. The result is less overload and steadier coverage.
The same approach helps with hiring. HR management tools and HCM data can show vacancy trends, like roles staying open for 60–90 days or the same program posting repeated openings. Those patterns often point to deeper staffing gaps that overtime won’t solve for long.
NYC Health + Hospitals provides a real-world example of the impact of a broader workforce strategy. The health system reported that behavioral-health turnover fell from nearly 18% in 2022 to 8%, while vacancies declined to 6%. Since January 2024, the system has hired about 100 psychiatrists, nearly 20 psychiatric nurse practitioners, and more than 400 social workers.
Those patterns also give leaders a starting point for tracking turnover, vacancy, and coverage over time. Once staffing changes are in place, they can check whether burnout risk, retention, and coverage are moving in the right direction.
How to Measure Results and Sustain Progress
Track Workforce, Care, and Compliance Outcomes Together
Measuring results is what turns workforce visibility into burnout prevention. Once visibility shows where strain is building, the next step is simple: check whether conditions are actually getting better. The best way to do that is to track three groups of outcomes side by side: workforce outcomes, care outcomes, and compliance/operational outcomes.
Workforce outcomes include voluntary turnover rate, overtime hours per FTE each pay period, caseload spread across similar roles, documentation timeliness, PTO use, and staff well-being survey scores. For documentation timeliness, that might mean the share of notes finished within 24–48 hours. Care outcomes include no-show rates and continuity-of-care measures, such as the percentage of visits handled by a client's primary assigned clinician. Compliance and operational outcomes include on-time completion of required documentation, audit findings, claim denials tied to documentation errors, and expired credentials.
These measures tend to move together. When caseload spread comes down and overtime becomes steadier, documentation timeliness often improves too. Missed visits may drop as well.
Review overtime, caseload variance, and documentation timeliness every week. Slower-moving indicators, like retention, turnover, and well-being survey scores, make more sense to review monthly or quarterly. That gives leaders a better read on actual trends instead of reacting to short-term swings.
Before rollout, gather at least 3–6 months of historical data so targets are grounded in reality. From there, you can set time-bound goals that people will take seriously, such as:
- Reducing average overtime by 15% within six months
- Narrowing caseload variance by 25% over two quarters
- Improving documentation timeliness by 10 percentage points within three months
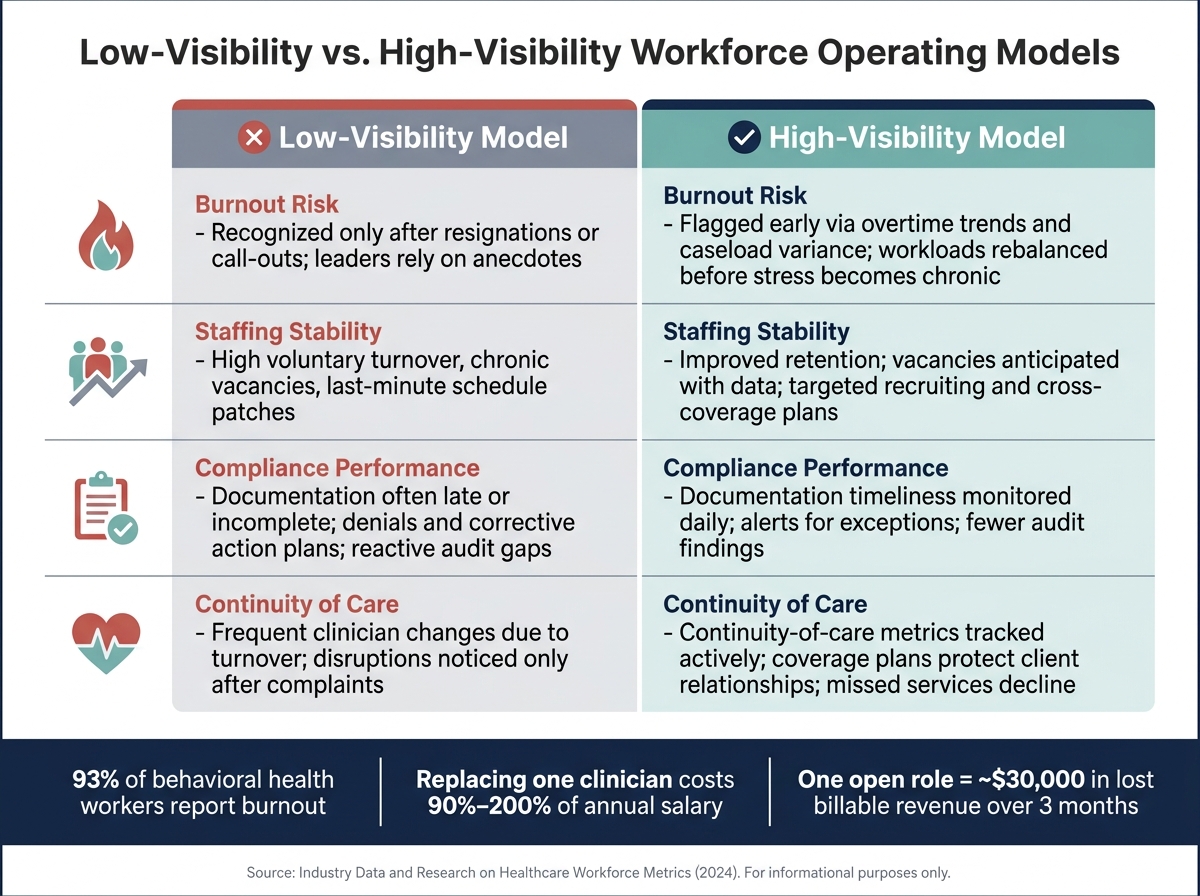
Those patterns help show whether the organization is drifting toward a low-visibility model or building a high-visibility one.
Low-Visibility vs. High-Visibility Operating Models: A Side-by-Side Comparison
That gap becomes clear in day-to-day work.
| Dimension | Low-Visibility Operating Model | High-Visibility Operating Model |
|---|---|---|
| Burnout risk | Recognized only after resignations, call-outs, or errors; leaders rely on anecdotes to judge strain | Flagged early via sustained overtime, rising caseload variance, and declining survey scores; workloads are rebalanced before stress becomes chronic |
| Staffing stability | High voluntary turnover, heavy agency staffing, and chronic vacancies; schedules are patched together at the last minute | Improved retention and lower turnover due to more equitable workloads; vacancies are anticipated using data and addressed with targeted recruiting and cross-coverage plans |
| Compliance performance | Documentation often late or incomplete, causing denials and corrective action plans; audit gaps are reactive and stressful | Documentation timeliness is monitored daily; exceptions trigger alerts; fewer audit findings and less last-minute scrambling |
| Continuity of care | Clients frequently experience clinician changes due to turnover and unplanned absences; disruptions are noticed only after complaints | Continuity-of-care metrics are tracked actively; coverage plans protect relationships during PTO or vacancies; missed services decline over time |
Conclusion: Better Visibility Supports a Healthier Workforce and Better Care
When leaders review these measures on a fixed cadence, they have a much better shot at keeping progress in place. Burnout rarely arrives all at once. It builds quietly through uneven caseloads, untracked overtime, and documentation pressure that piles up week after week.
Real-time visibility gives leaders a chance to step in earlier, before strain turns into turnover. And when that visibility is paired with steady measurement and clear response rules, organizations are in a stronger position to improve employee well-being, strengthen retention, maintain compliance, and deliver more consistent care to the people they serve.
FAQs
How can I spot burnout risk before staff quit?
Move past static reports and use integrated systems that show what's happening across your workforce in real time. Track metrics like workload distribution, overtime, absenteeism, and engagement so you can spot early signs of stress before they turn into something worse.
Weekly pulse surveys, predictive analytics, and automated dashboards can surface warning signs, like a jump in sick days or too many back-to-back sessions. That gives managers a chance to rebalance workloads or step in with support before an employee hits a breaking point.
Which workforce metrics should I track first?
Start with position control to track authorized roles, open roles, and budget alignment. That gives you a clear view of system capacity, not just the people currently in seats.
Then keep an eye on:
- turnover and vacancy duration by program or supervisor
- time-to-fill for critical roles
- overtime and labor costs per position
- caseload distribution, complexity, and direct service hours
- absenteeism, pulse survey results, and clinical note completion time
How often should leaders review burnout data?
Leaders should shift from occasional reporting to real-time, continuous monitoring. Manual or outdated reports slow decisions and make it harder to step in at the right moment.
Modern workforce tools give teams a steady view of what’s happening through automated weekly pulse surveys and real-time dashboards. When leaders track workload distribution, absenteeism, and schedule gaps, they can spot pressure points early and act before those issues turn into turnover.